
How Much Monthly Income Can $500K–$1M Generate in Retirement in Ontario?
A $1,000,000 portfolio invested in an income-focused portfolio with a 6% distribution yield can generate roughly $5,000 per month before tax. A $500,000 portfolio at the same yield produces about $2,500 per month. Layer in Canada Pension Plan and Old Age Security, and a typical Ontario couple with $1,000,000 saved can realistically build a household retirement income of $8,000–$9,000 per month before tax.
That’s the short answer. The longer answer — the one that actually determines whether your money lasts — depends on how the income is generated, which accounts it comes from, and how you protect yourself in the first five years of retirement. Here’s how we walk clients through it at our practice in Bowmanville.
The Short Answer: A Monthly Income Table
The simplest way to think about retirement income is distribution yield: the cash your portfolio pays out each year as a percentage of its value. Here’s what different portfolio sizes produce at different yields, before tax:
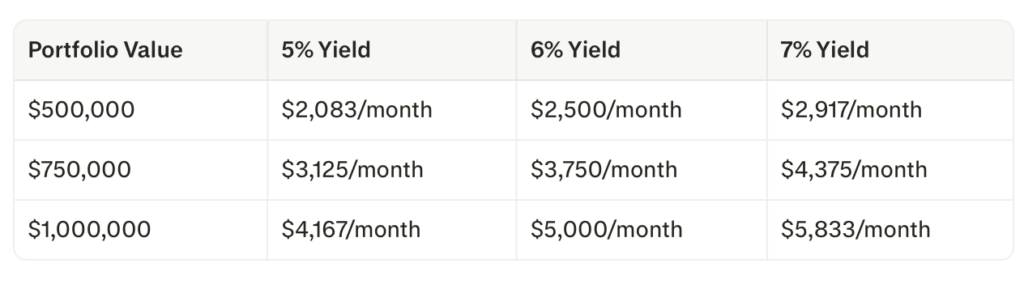
Two things matter about this table.
First, these yields are real and investable. Our Lifetime Income Portfolio™ — the income model we build for retiring clients — targets a 6–8% distribution yield using monthly-paying income funds. Several of the underlying mandates publish fixed distribution rates, though it’s important to understand those rates are fixed but not guaranteed, and portfolio values still fluctuate.
Second, yield is not the same as return. A portfolio can pay you 6% in cash while its market value rises or falls. That distinction — income you can spend versus a balance you watch — is the core of retirement income planning, and it’s why the strategy that got you to retirement usually isn’t the one that gets you through it.
What CPP and OAS Add on Top
Your portfolio doesn’t work alone. For 2026, the government benefit figures look like this:
- CPP: The maximum retirement pension at age 65 is $1,507.65 per month, but the average new recipient gets $877.01 (Government of Canada, CPP payment amounts).
- OAS: The maximum for ages 65–74 is $751.97 per month for the July–September 2026 quarter, rising 10% at age 75 (Government of Canada).
For a couple where both spouses receive average CPP and full OAS, that’s roughly $3,250 per month of government income. Add a $1,000,000 portfolio paying 6%, and the household picture looks like this:
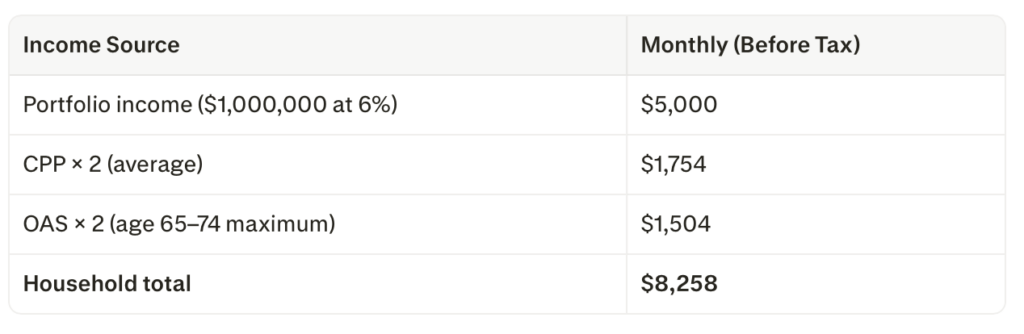
One planning note: OAS starts getting clawed back once your individual net income exceeds $95,323 (2026 tax year). With meaningful portfolio income, the order you draw from your accounts — and whether income is split between spouses — directly affects how much OAS you keep. This is exactly the kind of coordination a written retirement income plan is for.
Why We Don’t Just Use the 4% Rule
You’ve probably read that you can safely withdraw 4% of your portfolio each year. The 4% rule is a useful academic starting point, but it was built on assumptions — a US-centric 50/50 stock-bond portfolio and a 30-year horizon — that don’t describe how most Ontario retirees actually invest or live.
The practical problem with a withdrawal-rate approach is that it forces you to sell units to create income. When markets are down, you’re selling more units at lower prices to produce the same dollars — and those units never recover, because you’ve spent them.
A distribution-yield approach flips this: the portfolio is built from mandates that generate cash flow — option-premium strategies, covered-call equity, real asset and infrastructure income — so the monthly income arrives without forced selling. Your unit count stays intact through a downturn, which is precisely when that matters most.
Sequence-of-Returns Risk: The First Five Years Decide Everything
Here’s the commentary I give every retiring client, because it’s the single most important concept in this entire topic.
Two retirees can earn the identical average return over 25 years and end up in completely different places, purely because of the order in which the returns arrived. A retiree who hits a bear market in years one to three of retirement — while drawing income — can permanently impair their portfolio, even if markets fully recover afterward. The same bear market in year fifteen is a non-event.
This is sequence-of-returns risk, and it’s why the five years before and after your retirement date are called the retirement risk zone. Managing it isn’t about predicting markets. It’s about structure:
- Income from distributions, not unit sales, so downturns don’t force you to sell low.
- A cash wedge covering near-term spending, so no single bad year dictates your lifestyle.
- A written drawdown order across RRIF, TFSA, and non-registered accounts that adapts as tax brackets and clawback thresholds move.
The Tax Layer: Where the Money Sits Changes What You Keep
The same $5,000 of monthly income can leave very different amounts in your pocket depending on the account it comes from:
- RRIF income is fully taxable, and CRA sets minimum withdrawals that rise with age. Drawing your RRSP/RRIF down strategically — sometimes earlier than required — can reduce lifetime tax and protect OAS.
- TFSA income is completely tax-free and doesn’t count toward the OAS clawback, which makes it the most valuable income real estate you own in retirement.
- Non-registered income depends on tax character: eligible dividends, capital gains, and return of capital are each taxed differently — and some income-fund distributions are significantly more tax-efficient than interest income.
This is why two households with identical portfolios can keep meaningfully different after-tax incomes. The plan matters as much as the portfolio.
A Durham Region Example: Turning Home Equity into Income
Here’s a scenario we see regularly in Bowmanville, Newcastle, and Port Hope: a couple in their late 60s, mortgage-free home now worth more than they ever expected, modest RRSPs, and a feeling that they’re “house rich, income poor.”
Selling the home, investing the net proceeds, and renting — or downsizing and investing the difference — can convert dormant equity into permanent monthly income. Net proceeds of $800,000 invested at a 6% distribution yield produce about $4,000 per month before tax, on top of CPP and OAS. Because our practice is licensed on both sides — financial planning and real estate — we can model the entire waterfall: sale price, commissions, mortgage payout, legal fees, and the income the remaining capital generates, all in one document before you ever list.
It isn’t the right move for everyone. But it deserves real math, not a rule of thumb.
Frequently Asked Questions
Is $500,000 enough to retire in Ontario?
For many couples, yes — if the portfolio is structured for income. $500,000 at a 6% distribution yield generates about $2,500 per month, and combined with average CPP and OAS for two spouses, household income can reach $5,700+ per month before tax. Whether that’s enough depends on your spending, housing situation, and health — which is what a written plan establishes.
How long will $1 million last in retirement?
With a distribution-yield approach, the goal is for the capital to remain substantially intact — you spend the income, not the principal. Under a withdrawal-rate approach, $1 million supporting $60,000 of annual spending typically lasts 25–30 years depending on returns and inflation. The structure you choose is the biggest variable.
Is a 6% distribution yield guaranteed?
No. Distribution rates on income funds are set by the fund companies and can change; several are fixed by design but explicitly not guaranteed, and market values fluctuate. That’s why we pair the income portfolio with a plan that stress-tests lower yields and negative markets.
Do portfolio distributions affect my OAS?
They can. Taxable distributions count toward the net income tested against the OAS clawback threshold ($95,323 for 2026). TFSA income doesn’t count, which is one reason withdrawal order matters so much.
The Next Step
If you’re within five years of retirement — or already there — the most valuable thing you can do is see your own numbers: your accounts, your CPP estimates, your yield, your tax picture, in one integrated illustration.
That’s a conversation we have every week with families across Bowmanville, Port Hope, Oshawa, Newcastle, and Whitby. Book a complimentary consultation through HarmerWealth.com and we’ll build your retirement income picture together.
Chad Harmer, PFP, CIM, FCSI, MBA — Founder & Senior Wealth Advisor, Harmer Wealth Management Corp.
This article is for general information only and does not constitute personalized investment, tax, or legal advice. Distribution rates are set by fund companies and are not guaranteed; market values fluctuate and past performance does not guarantee future results. Mutual funds are offered through Investia Financial Services Inc. Please consult a licensed professional about your specific situation.